1Research Scholar, Faculty of Pharmacy, Oriental University, Indore (M.P.)
2Faculty of Pharmacy, Oriental University, Indore (M.P.)
Corresponding Author Email: kanungoaniket8@gmail.com
Article Publishing History
Received: 10/01/2025
Accepted After Revision: 18/03/2025
Zanamvir hydrochloride was developed and validated for use in pharmaceutical formulations and bulk samples. Zanamvir hydrochloride is an agonist for D2 dopamine receptors. Pituitary lactotroph (prolactin) cells are directly inhibited by zanamavir hydrochloride. The technique was developed using Symmetry C18, 250 x 4.6 mm I.D., 5 μm particle size, and 1.0 mL/min flow rate. The ideal mobile phase conditions are 40:30:30 (v/v/v) ratios of sodium dihydrogenphosphate, 1% orthophosphoric acid, and nitrile. The wavelength was 275 nm, and the column temperature was room temperature. The duration needed for analysis is 5 minutes, while the approach has a much shorter runtime with a better peak shape at 1.655 minutes.
For verified parameters, the approach was proven to be linear, accurate, robust, and tough. An external standard calibration technique was used to assess the linearity range in the concentration range of 5μg/ml to 25μg/ml (r2═ 0.999). It showed a broad linearity range for the analysis of the Zanamvir hydrochloride concentrations. The results showed that the LOD was 0.4 μg/ml and the LOQ was 1.5 μg/ml. Tests were conducted on the system suitability characteristics, including the number of theoretical plates, asymmetry factor, tailing factor, and capacity factor. Recovery was estimated to be between 99.66 and 100.16%, and all values were found to be within the range. The repeated examination of the formulation further validated the method’s accuracy.
Zanamvir hydrochloride, Standard calibration, Validation, Accuracy.
Kanoongo A, Vengurlekar S, Jain S.K. Validation of Spectroscopic Method for the Determination of Some Antiviral Drug . International Journal of Biomedical Research Science (IJBRS). 2025;01(1).
Kanoongo A, Vengurlekar S, Jain S.K. Validation of Spectroscopic Method for the Determination of Some Antiviral Drug. International Journal of Biomedical Research Science (IJBRS). 2025;01(1). Available from: <a href=”https://shorturl.at/9jqDR“>https://shorturl.at/9jqDR</a>
| Standard Concentration | 70µg/ml | |
| Pump mode | Isocratic | |
| Mobile phase | Methanol:Acetonitrile:0.1%Orthophosphoric
Aidintheratioof75:20:05(V/V/V) |
|
| Mobile Phase PH | 4.8 | |
| Wavelength | 243nm | |
| Column | C18column(250X4.6mm,5μ) | |
| Column Temp | Ambient | |
| Diluent | Methanol | |
| Injector | Rheodyne | |
| Injection Volume | 20μl | |
| Flowrate | 1ml/min | |
| Retention Time | Zanamvir hydrochloride | 3.30min |
| Runtime | 10min | |
| Peak Area | Zanamvir hydrochloride | 271253 |
| Theoretical plates | Zanamvir hydrochloride | 7684 |
| Tailing Factor | Zanamvir hydrochloride | 1.90 |
| Pump Pressure | 9.5±5MPa | |
Figure 1: Chromatogram of Blank
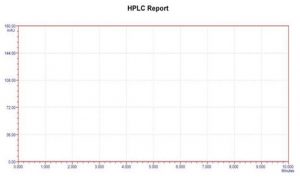
Figure 2: Chromatogram of Standard
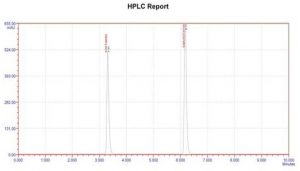
Figure 3: Chromatogram of Zanamvir hydrochloride single
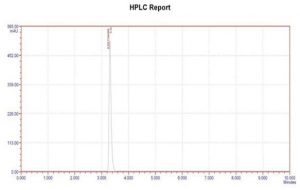
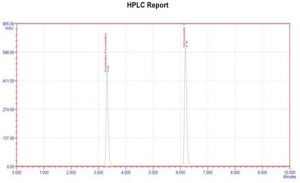
Figure 4: Chromatogram of Formulation
VALIDATION OF THE PROPOSED METHOD
According to ICH guidelines, the suggested approach was validated. Specificity, linearity, precision, accuracy, robustness, system appropriateness, limit of detection, and limit of quantification were the parameters examined for validation.
Table 2. Result of Specificity analysis
| Name of the solution | Retention Time in Min |
| Blank | No peaks |
| Zanamvir hydrochloride | 1.65minutes |
Specificity: The capacity to precisely and specifically measure the analyte of interest in the presence of components that may be predicted to be present in the sample matrix is known as the analytical method’s selectivity. A method is referred to as selective if it can qualitatively detect the analyte and separate and resolve the different components of a mixture.It has been noted that there were place boat main peaks and diluent peaks. This demonstrates the selectivity and specificity of the chromatographic technique employed for the simultaneous measurement of zamavir hydrochloride. Studies on specificity show that the excipients had no effect on the analysis. For Zanamvir hydrochloride, the standard solution displayed a symmetric peak with retention times of 3.30 minutes. The chromatogram shows no excipient interference. This suggests that the suggested approach is particular.
Table 3. System suitability results
| Retention Time | Zanamvir hydrochloride | 1.65min |
| Peak Area | Zanamvir hydrochloride | 432056 |
| Theoretical plates | Zanamvir hydrochloride | 5926 |
| Tailing Factor | Zanamvir hydrochloride | 1.53 |
| Resolution Factor | Zanamvir hydrochloride | ………. |
System suitability: Tests for system suitability were conducted using a newly made standard stock solution of Zanamvir hydrochloride. A standard concentration in an equal volume was thoroughly blended. The system appropriateness of the established approach was expressed using the results of injecting 20 μl of the sample from the produced solution into an HPLC system. Results for system suitability were displayed in the table.
Table 4. Linearity results of Zanamvir hydrochloride
| S.NO | CONC µg/ml | Area of Zanamvir hydrochloride |
| 1 | 50 | 199726 |
| 2 | 60 | 238655 |
| 3 | 70 | 271253 |
| 4 | 80 | 305211 |
| 5 | 90 | 342830 |
| 6 | 100 | 388644 |
| Concentration range | 50- | 50-100µg/ml |
| Slope(m) | 100µg/ml | 5381 |
| Intercept(b) | 3829 | 1063 |
| Correlation | 3285 | 0.999 |
| coefficient | 0.999 |
Linearity: Different amounts of the standard stock solution of Zanamvir hydrochloride were taken and mixed to different concentrations of 50–100 µg/ml in a set of seven standard test tubes. Each flask was injected with 20μl. At 243 nm, the solutions’ peak area responses were noted. Peak area plotted against Zanamvir hydrochloride concentrations were found to be linear in the 50–100 µg/ml range, with a coefficient of correlation (r2) of 0.999 for Zanamvir hydrochloride and a regression equation of Y=3829X+3285 for Zanamvir hydrochloride.
Accuracy: The direct addition approach was used to assess the method’s accuracy. The 50%, 100%, and 150% levels of the usual addition procedure were used. According to the suggested methodology, the solutions were examined in triplicate at every stage. The percentage recovery was computed, and the results were shown in a table. With the suggested approach, satisfactory recoveries for ezetimibe from 98.9 to 100.38% for zanamvir hydrochloride were achieved. The recovery values support the method’s accuracy. It is confirmed that the approach is accurate and free from any positive or negative interference of the excipients because the recovery values were achieved within the standard limit. This suggests that the suggested approach was accurate.
Table 5. Precision results for Zanamvir hydrochloride
| Recovery | Conc. Of sample |
Zanamvir hydrochloride estimated |
Zanamvir hydrochloride % of recovery |
| 50% |
50ppm |
50.33 | 100.66 |
| 50.11 | 100.22 | ||
| 49.88 | 99.76 | ||
| 75% |
75ppm |
74.92 | 99.89 |
| 74.88 | 99.5 | ||
| 75.01 | 100.1 | ||
| 100% |
100ppm |
99.1 | 99.1 |
| 99.6 | 99.6 | ||
| 99.5 | 99.5 | ||
| Mean | 99.81 |
Precision: Repeatability entails the analyst doing the precision study over time and analyzing replicates using the same tools and techniques. The solution with a concentration equal to the standard concentration was used for the repeatability study. The method’s precision was measured as intraday and intraday precision.
Table 6. Intra-day precision results of Zanamvir hydrochloride.
|
Conc. |
Injection No. |
Zanamvir hydrochloride peak area response |
|
70µg/ml |
1 | 271253 |
| 2 | 272219 | |
| 3 | 272481 | |
| 4 | 271685 | |
| 5 | 272051 | |
| 6 | 273272 | |
| RSD | 0.25 |
Intra-day precision: Six duplicate standard solutions of Zanamvir hydrochloride (70µg/ml) were injected to examine the intra-day precision. Zanamvir hydrochloride’s percent relative standard deviation (% RSD) was determined to be 0.25, falling well within the permitted range of no more than 2.0. The good reproducibility of the analytical procedures was established. The table displays the findings of system precision investigations.
Inter day precision: Six duplicate standard solutions of zanamvir hydrochloride (70µg/ml) were injected on three separate days in order to examine the interday precision. Zanamvir hydrochloride was found to have a percent relative standard deviation (% RSD) of 1.23, which falls well within the permissible range of 2.0. The analytical method demonstrated good repeatability, it was confirmed. System precision study results are displayed in the table.
Table 7. Inter day precision results of Zanamvir hydrochloride.
|
Conc. |
Injection No. |
Zanamvir hydrochloride peak Area response |
|
70µg/ml |
1 | 274666 |
| 2 | 266547 | |
| 3 | 268688 | |
| 4 | 271303 | |
| 5 | 272481 | |
| 6 | 268039 | |
| RSD | 1.23 |
Robustness: Depending on the technique being studied, the evaluation of robustness should be taken into account during the development phase. It demonstrated the analysis’s dependability with regard to intentional changes in the method’s parameters. A robustness test was conducted by varying the chromatographic settings slightly at a concentration equivalent to the standard concentration, which is 70 µg/ml, and calculating the percentage change in the findings. Here, robustness was achieved by varying the detector’s wavelength, mobile phase ratio, and mobile phase flow velocity. These modified experimental conditions were used to analyse zanamvir hydrochloride at a concentration of 70µg/ml. A calculation of the findings’ percentage change revealed that it was within the acceptable range of beneath 2. This suggests that the suggested approach is sound. Results were displayed in the table.
Table 8. Robustness results of Zanamvir hydrochloride.
| S.NO | Parameter | Condition | Zanamvir hydrochloride | |
| Area | %of change | |||
|
1 |
Standard |
Standard
conditions |
271253 |
…….. |
|
2 |
Mobile phase |
MeOH:ACN:0.1
%O.P.A70:25:05 |
432954 |
0.73 |
| 80:15:05 | 273252 | 0.74 | ||
|
3 |
Mobile
Phase PH |
5.0 |
270644 |
0.225 |
| 4.6 | 273625 | 0.87 | ||
| 4 | Wavelength | 274 nm | 269963 | 0.48 |
| 249 nm | 270583 | 0.25 | ||
Ruggedness: Six replicate injections of a standard solution with a concentration of 70 µg/ml were used to perform inter-day variations. These injections were produced and examined by a different analyst on three separate days over the course of a week. Zanamvir hydrochloride was found to have a percent relative standard deviation (% RSD) of 0.21, which falls well within the permissible range of 2.0. The analytical method demonstrated good repeatability, it was concluded. System precision study results are displayed.
Table 9. Ruggedness results of Zanamvir hydrochloride.
|
Conc. |
Injection No. |
Zanamvir peak area response |
|
70µg/ml |
1 | 271443 |
| 2 | 270794 | |
| 3 | 270954 | |
| 4 | 271511 | |
| 5 | 270833 | |
| 6 | 272268 | |
| RSD | 0.21 |
Limit of Detection: By comparing measured signals from samples with known low analyte concentrations with those of blank samples, the signal-to-noise ratio is calculated, allowing one to determine the lowest concentration at which the analyte can be consistently identified. In general, a signal-to-noise ratio of 2:1 is regarded as suitable for evaluating the detection limit. The LOD for Zanamvir hydrochloride is 1.2µg/ml.
Quantization Limit: The analysis of samples with known analyte concentrations and the establishment of the lowest level at which the analyte can be quantified with acceptable accuracy and precision are typically used to determine the quantisation limit. Zanamvir hydrochloride has a LOQ of 4µg/ml.
Formulation: The analysis of samples with known analyte concentrations and the establishment of the lowest level at which the analyte can be quantified with acceptable accuracy and precision are typically used to determine the quantisation limit. Zanamvir hydrochloride has a LOQ of 4µg/ml.
Table 10. Formulation results of Zanamvir hydrochloride
| S.NO | Drug | Tablet | Dosage | Sample conc | Amount found | % of Drug Estimated
in Tablet |
| 1 | Ezetimibe | Lemicil | 10mg | 70µg/ml | 69.87
µg/ml |
99.85 |
DISCUSSION
For the quantification of Zanamvir hydrochloride, a reverse phase high performance liquid chromatographic technique that is straightforward, specific, accurate, exact, and sensitive has been devised. Using a spectrophotometer, the wavelengths of the two medications that absorb the most light were verified. In order to separate the medicines with high resolution, high theoretical plates, and a lower tailing factor, the stationary and mobile phases were chosen by randomly altering the various ratios of mobile phases and stationary phases. Ultimately, it was successful at an ODS C18 column with a mobile phase ratio of methanol: acetonitrile: 0.1% or orthophosphoric acid 75:20:05 (v/v/v). The most appropriate circumstances for the simultaneous analysis of Zanamvir hydrochloride were discovered to be a detection wavelength of 243 nm. The ideal chromatographic conditions were demonstrated.
It was determined that the linear regression response was linear for a series of concentrations in the 50–100 µg/ml range. The correlation coefficient (r2) for Zanamvir hydrochloride was 0.999, and the calibration curve equation was determined to be Y=3829X+3285. With a high correlation coefficient and fewer intercepts, Zanamvir hydrochlorides displayed the best response on the regression equation. The table displays the results of the calibration curves’ regression analysis. For the analysis of many excipients often found in the tablet dosage form of Zanamvir hydrochloride, selectivity and specificity were investigated. They did not interfere with the assay, according to the results.
Representative chromatograms were subjected to a suitability test for a number of criteria. It was discovered that a large number of theoretical plates for Zanamvir hydrochloride were seen with a high resolution and a low tailing factor. Both compounds have a short run time and great resolution, eluting in 3 minutes. The outcomes fell within the permitted ranges of theoretical plates >2000, resolution factor >2, and tailing factor ≤2.0 (Table 5.3).The results showed that the devised approach had a high resolution and the quickest run time. This attests to the method’s ease of use and reduced analysis time. The suggested techniques were verified in accordance with ICH criteria.
A sufficient number of aliquots of a homogeneous sample were taken within the day (intraday) and the next three days for interday precision in order to quantify accuracy in terms of repeatability. Within the permitted range of two in intra-day and inter-day precision for Zanamvir hydrochloride, the percentage RSD for each instance was determined. This demonstrated that the approaches’ accuracy is enough. The degree to which the measured value closely resembles the sample’s real value is known as accuracy. Recovery analysis of the produced solution (three replicates) against the reference solution revealed the accuracy of the label claim. The accuracy and repeatability of the suggested approaches were investigated using the discovery process. This was accomplished by mixing specific amounts of pre-analyzed formulations with known quantities of the Zanamvir hydrochloride solution, and then analysing the resulting mixes.
The suggested techniques were used to determine the total quantity of Zanamvir hydrochloride, and the difference was used to compute the amount of additional medicine. Recovery was done in triplicate using the usual addition procedure, which added 50%, 100%, and 150% to a standard, pre-analyzed sample of 20 µg/ml. Each case’s percentage recovery for Zanamvir hydrochloride was assessed and determined to be between 98.05 and 101.76%. This was determined to be well within the 98–102% acceptability range. This demonstrated that the Zanamvir hydrochloride recoveries using the suggested procedures were adequate. Results of the recovery were intelligible. Small variations in the chromatographic conditions were used to conduct the robustness test, and the percentage change in the results was computed. Here, resilience was achieved by altering the detector’s wavelength, mobile phase PH, and mobile phase ratio.
These altered experimental conditions were used to analyse zanamvir hydrochloride at a concentration of 70µg/ml. After calculating the percentage change in the findings, it was determined to be below the acceptable threshold. The robustness results show that a change in the developed conditions does not significantly alter the results. As a result, the developed method is robust. The results demonstrated robustness. Six duplicate injections of a standard solution of concentrations that were made and examined by several analysts on three separate days over the course of a week were used to perform robustness. Zanamvir hydrochloride’s percent relative standard deviation (% RSD) was determined to be 0.21, comfortably within the permitted range of no more than 2.0.
The analytical methods demonstrated high reproducibility, it was determined. Results for ruggedness were intelligible. In general, a signal-to-noise ratio of 2:1 is regarded as adequate for evaluating the detection limit. Zanamvir hydrochloride’s LOD and LOQ are determined to be 1.2µg/ml and 4µg/ml, respectively. Zanamvir hydrochloride commercial pills were assayed using the established technique.
%assay was calculated using the detector response’s peak area. Zanamvir hydrochloride has a 99.85% assay percentage. The table displayed the results. There was considerable concordance between the findings and the labeled material. As a result, the approach created for this study was straightforward, sensitive, accurate, robust, quick, and exact. The chromatogram’s lack of extra peaks showed that the usual excipients used in the tablets were not interfering. Therefore, the aforementioned technique may be effectively used to estimate the amount of Zanamvir hydrochloride in tablet dosage forms.
CONCLUSION
Due to their significance in quality control, analytical research has focused a lot of effort on the development of HPLC techniques for drug detection. Because of its affordability, accessibility, and ease of use, HPLC is a special, adaptable, ubiquitous, and fundamental tool that is widely used by researchers. The goal of the current study was to create a quick and easy HPLC approach for the regular analysis of eleven different medications in tablet and bulk form. The analytical column, solvent selection, mobile phase composition, flow rate, and detector wavelength were all examined for this reason. According to ICH criteria, the created method conditions are put through validation. This section discusses chemical analysis, which encompasses both classical and instrumental analysis used in pharmaceutical drug analysis.
A brief overview of high performance liquid chromatography and its equipment is included, along with information on the methods used for estimating pharmaceutical formulations using chromatic graphic techniques. The method development process is followed by general method validation procedures and validation procedures for assay methods in accordance with ICH guidelines. focuses on the creation and verification of Zanamvir hydrochloride for use in pharmaceutical formulations and bulk samples. With a flow rate of 1.0 mL/min, the method development was carried out using a Zodiac C18 column (250 x 4.6 mm, 5 μ).The ideal ratio of methanol, water, and acetonitrile (v/v) for the mobile phase was 50:30:20.The wavelength was 218 nm, and the column temperature was ambient. For verified parameters, the approach was proven to be linear, accurate, robust, and robust. An external standard calibration technique was used to assess the linearity range in the concentration range of 2μg/ml to 10μg/ml (r2⅐ 0.999).
The results showed that the LOD was 0.05 μg/ml and the LOQ was 0.165 μg/ml. As a result, the technique condition is so sensitive that it can analyse concentrations down to the nanogramme level. The number of theoretical plates, capacity factor, asymmetry factor, tailing factor, and other system appropriateness factors were investigated. The recovery rate was determined to be between 99.5 and 101.2%, and all of the values were found to be within the range. The repeated examination of formulation further validated the method’s accuracy.
The intraday and interday percentage RSDs were determined to be 0.588 and 0.918, respectively. It demonstrated the method’s high level of accuracy. The low percentage RSD figure showed that the excipients employed in the formulation did not cause any interference. Thus, the method’s correctness was verified. Better turnaround of analytical values is provided by this procedure. Assays for individual samples were conducted using the same methodology, and the results showed that the values were in good agreement. Therefore, this will be a great way to determine the assay and content uniformity of Zanamvir hydrochloride in oral solid dosage form.
Simple, isocratic conditions, shorter run time, low injection volume, smaller particle size, lower flow rate, and affordable mobile phases are only a few of the method’s numerous benefits. With a decent peak shape (peak tailing factor<2) and a runtime of 10 minutes, the retention duration of Zanamvir hydrochloride was around 7.05 minutes under these conditions.
Zanamvir hydrochloride was developed and validated for use in pharmaceutical formulations and bulk samples. Zanamvir hydrochloride is an agonist for D2 dopamine receptors. Pituitary lactotroph (prolactin) cells are directly inhibited by zamavir hydrochloride. The technique was developed using SymmetryC18, 250 x 4.6 mm I.D., 5 μm particle size, and 1.0 mL/min flow rate. The ideal mobile phase conditions are 40:30:30 (v/v/v) ratios of sodium dihydrogenphosphate, 1% orthophosphoric acid, and nitrile. The wavelength was 275 nm, and the column temperature was room temperature.
The duration needed for analysis is 5 minutes, while the approach has a much shorter runtime with a better peak shape at 1.655 minutes. For verified parameters, the approach was proven to be linear, accurate, robust, and tough. An external standard calibration technique was used to assess the linearity range in the concentration range of 5μg/ml to 25μg/ml (r2═ 0.999). It showed a broad linearity range for the analysis of the Zanamvir hydrochloride concentrations. The results showed that the LOD was 0.4 μg/ml and the LOQ was 1.5 μg/ml.Tests were conducted on the system suitability characteristics, including the number of theoretical plates, asymmetry factor, tailing factor, and capacity factor. Recovery was estimated to be between 99.66 and 100.16%, and all values were found to be within the range. The repeated examination of the formulation further validated the method’s accuracy.
The intraday and interday percentage RSDs were determined to be 0.946 and 0.892, respectively. It demonstrated the method’s high level of accuracy. The low percentage RSD figure suggested that the excipients employed in the formulation were not causing any interference. Thus, the method’s accuracy was validated. This approach provides a greater return on analytical values. Assays for individual samples were conducted using the same methodology, and the results showed that values are in good agreement. For the assay determination and content uniformity of zanamvir hydrochloride in oral solid dosage form, this will be a great approach. Simple, isocratic conditions, quick run time, low injection volume, smaller particle size, lower flow rate, and inexpensive mobile phases are just a few of the method’s numerous benefits.Under these circumstances, the runtime was 5 minutes, and the retention duration of Zanamvir hydrochloride was around 1.655 minutes with a decent peak shape (peak tailing factor< 2).
creation and approval of a novel reverse phase HPLC technique for the measurement of Zanamvir hydrochloride in pharmaceutical formulations and bulk materials. The sensitivity, ease of use, accuracy, precision, and convenience of the suggested RP-HPLC technique are advantageous for the separation and quantification of Zanamvir hydrochloride in tablet form. The Zodiac C18 column (100 X 4.6 mm, 5μ) was used for the technique, and the mobile phase was made up of methanol and acetonitrile in a 60:40 (v/v/v) ratio. The effluent was monitored at 220 nm, and the flow rate was set at 1.5 ml/min. Zanamvir hydrochloride’s retention time under these circumstances was determined to be 3.57 minutes.
Specificity, accuracy, precision, linearity, limit of detection, limit of quantification, robustness, and solubility stability were all evaluated for the technique. The results of the Zanamvir hydrochloride sensitivity test showed that the technique could detect a concentration of 1.0 µg/ml and quantify at a concentration more than 3.3 µg/ml. The intra-day and inter-day precision RSD values were extremely low, indicating that the suggested approach was highly accurate. The method’s linearity was attained between 20 and 80 µg/ml, allowing for analysis at a broad range of concentrations. The suggested technique was successfully used for the quantitative measurement of Zanamvir hydrochloride in tablet dosage form, and recovery and other validation findings are good.
Zanamvir hydrochloride from their combined product was simultaneously estimated using an HPLC approach that was devised and later confirmed. Zanamvir hydrochloride belongs to a family of drugs known as cholesterol-lowering drugs, which are used to lower blood levels of cholesterol and other fatty compounds.
With an apparent pH adjusted to 4.8, the suggested RP-HPLC technique uses an Inertsil ODS C18 column (250 X 4.6 mm, 5μ) i.d. column, a UV detector for UV detection at 243 nm, and a mobile phase made up of methanol, acetonitrile, and 0.1% orthophosphoric acid in a ratio of 75:20:05 (V/V/V). In addition to specificity, response function, accuracy, system appropriateness, and precision, the provided technique has been validated. The standard and test solutions for Zanamvir hydrochloride have nominal values of 70μg/ml. For Zanamvir hydrochloride, the procedure described was linear throughout a range of 50–100µg/ml. The percentage recovery for each case was determined to be between 98.9 and 100.38% for Zanamvir hydrochloride. This was determined to be well within the 98–102% acceptance threshold. In general, a signal-to-noise ratio of 3:1 is regarded as suitable for evaluating the detection limit.
Zanamvir hydrochloride’s LOD is 1.2 µg/ml, whereas Zanamvir hydrochloride’s LOQ is 4 µg/ml.Zanamvir hydrochloride’s chromatographic peak purity data showed no co-eluting peaks with the major drug peaks, indicating the specificity of the assay technique for the detection of degradation products. Combination drug product quality control may benefit from the suggested approach.
REFERENCES
- Mitka M (May 2008). “Cholesterol drug controversy continues”. JAMA299 (19): 2266.
- Taylor A.J., Villnes T.C., Stanek E.J., et al. (26 November 2009). Extended-Release Niacinor Ezetimibe and Carotid Intima-Media Thickness. 361. 2113–22. http://guidance.nice.org.uk/TA132
- Garcia-Calvo M, Lisnock J, Bull HG, Hawes BE, Burnett DA, Braun MP, etal. The target of ezetimibe is Niemann-Pick C1-Like 1 (NPC1L1). Proc Natl Acad Sci USA 2005; 102 (23): 8132-7.
- Temel, Ryan E., Tang, Weiqing, Ma, Yinyan, Rudel, LawrenceL.,Willingham, Mark C., Ioannou, Yiannis A., Davies, Joanna P., Nilsson, Lisa-Mari, Yu, Liqing. Hepatic Niemann-Pick C1-like 1 regulates biliary cholesterol concentration and is a target of ezetimibe J. Clin. Invest.20070:JCI30060
- Di Piro JT, Talbert RL, Yee GC, Marzke GR, Wells BG, Posey LM, editors. Pharmacotherapy: a pathophysiologic approach. 7th ed. New York: The McGraw-Hill Companies, Inc.; 2008.
- Rossi S, editor. Australian Medicines Handbook 2006. Adelaide: Australian Medicines Hand book; 2006. http://www.bnf.org/bnf/bnf/current/128035.htm?q=”ezetimibe”
- Liao JK, Laufs U (2005). “Pleiotropic effects of statins”. Annu. Rev. Pharmacol. Toxicol. 45:89–118.
- Olivia Williams, Anne-Marie Jacks, Jim Davis, Sabrina Martinez (1998).”Case10: Merck (A): Mevacor”. In Allan Afuah. Innovation Management-Strategies, Implementation, and Profits. Oxford University Press. Retrieved 2006-07-19.